Mapping "One Lake" (Alternative C)
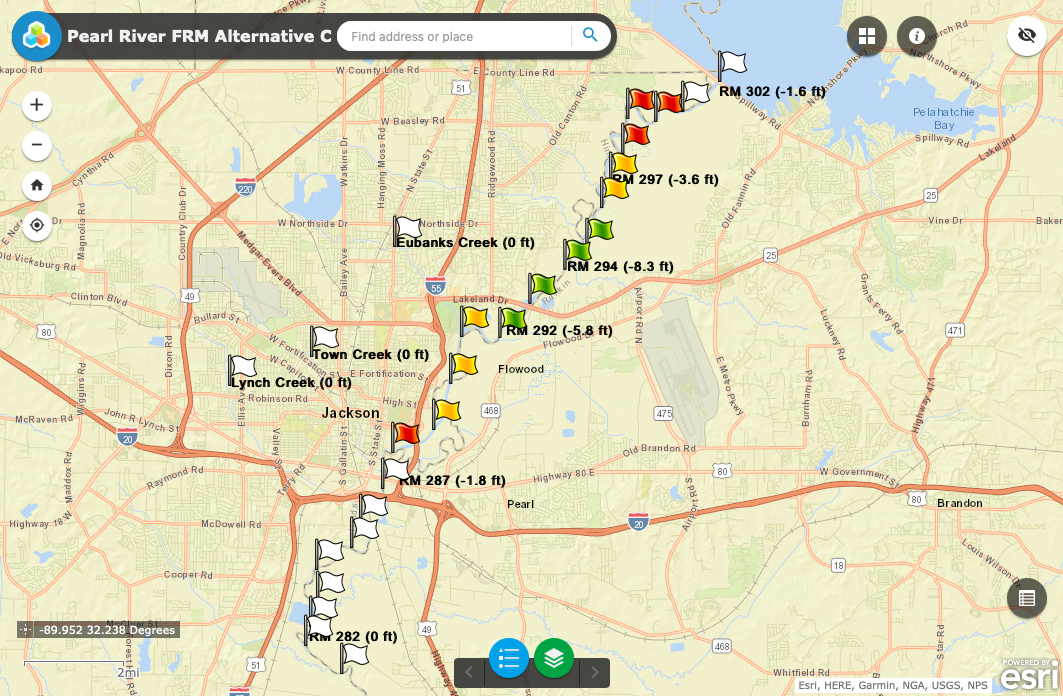
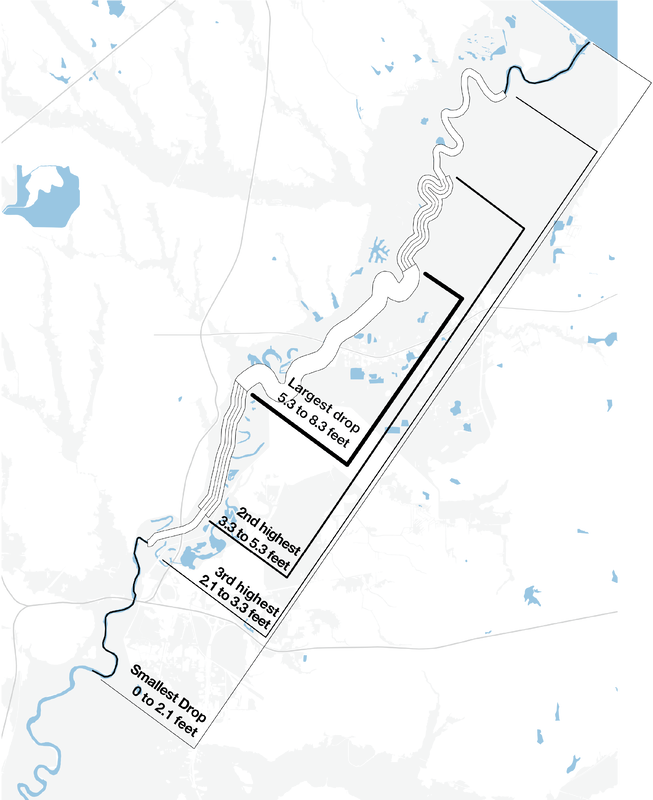
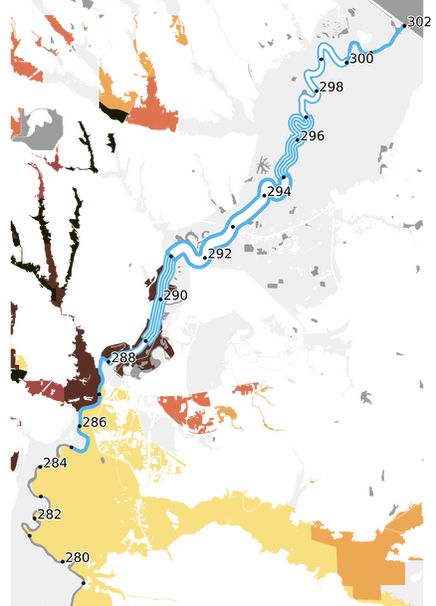
According to Table 3-3 in the 2018 DEIS Appendix C, the level of flood peak reduction provided by the "One Lake" project varies by river mile (RM). The most significant flood peak reduction benefits would be between the J.H. Fewell Water Plant, RM 291, and the area just upstream of Meadowbrook Lake, RM 295. To visualize which communities would receive the greatest levels of flood peak reduction benefits from "One Lake", Pearl Riverkeeper distributed the flood peak reduction numbers into four quantiles. Green flags = 5.3 to 8.3 feet. Yellow flags = 3.3 to 5.3 feet. Red flags = 2.1 to 3.3 feet. White flags = 0 to 2.1 feet. The map below depicts the level of flood peak reduction by RM predicted by the 2018 DEIS for a 1% annual exceedance flood event.
|
The maps and analysis below were created and authored by Juan Fernandez under contract for Healthy Gulf. Maps are licensed under Creative Commons, attribution and share alike, and may be used and shared with attribution to Juan Fernandez.
|
|
Mapping the study area
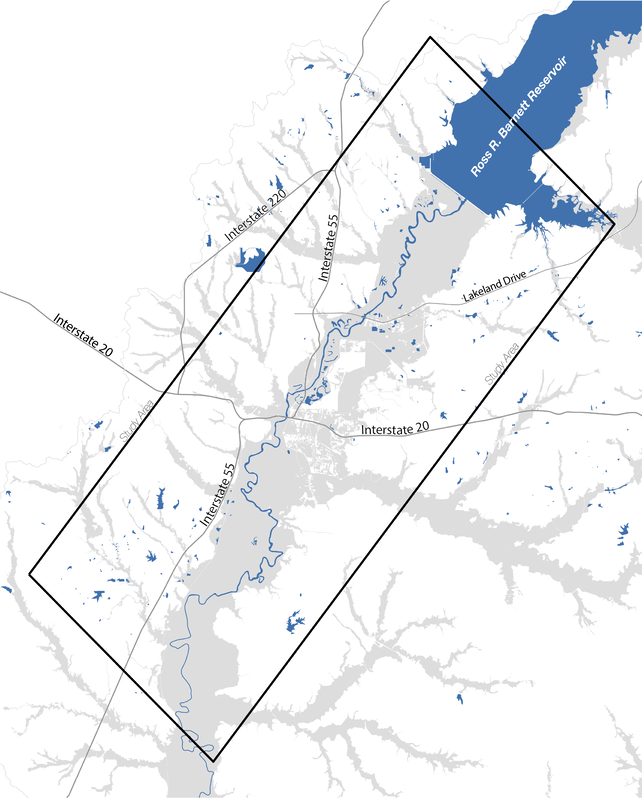
Section 4103 of the 2007 Water Resources Development Act authorized the Pearl River Basin Federal Flood Risk Management Project. The Assistant Secretary of the Army is authorized “to construct the project generally in accordance with the plan described in the ‘Pearl River Watershed, Mississippi, Feasibility Study Main Report, Preliminary Draft'". The referenced Feasibility Study describes a study area as the Pearl River Basin from River Mile 270, just south of Byram, to the Ross Barnett Reservoir Dam at River Mile 372. This area is mapped on the left. The blue represents the Pearl River, the Reservoir, and other water impoundments. The light gray region is the FEMA-defined 1.0% chance exceedance event zone, also known as the 100-year floodplain. It visualizes the flood hazard posed by the river and its tributaries. The map shows the region’s interstate highways and Lakeland Drive for reference. The rectangle represents the study area, which has been loosely defined by ellipses in maps produced by the Rankin-Hinds Pearl River Flood and Drainage Control District and by the U.S. Army Corps of Engineers. |
Flood reduction along the Pearl River
The relocation of the Rankin County levee and the large-scale excavation operation included in the "One Lake" project (Alternative C) will lower flood peaks along the river during high-flow events. The level of reduction varies by location.
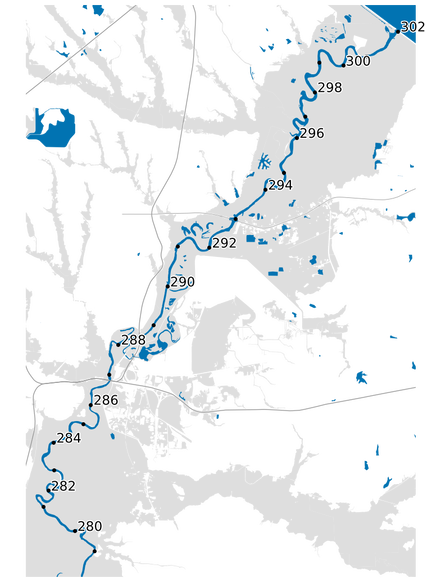
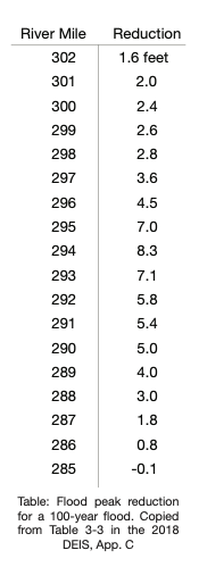
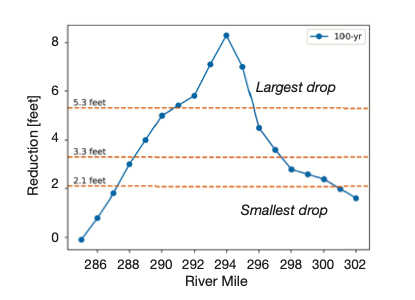
Table 3-3 of the 2018 DEIS, Appendix C, shows the anticipated flood peak reductions. The table below shows those reductions for a 1.0% annual chance exceedance event, also called a 100-year flood. The table can be cross-referenced with the map of the Pearl River showing River Miles (RM). (View a complete table of 2-yr, 5-yr, 25-yr, 50-yr, 100-yr, 200-yr and 500-yr flood peak reductions by river mile here.)
The most significant flood reduction benefits will be between the J.H. Fewell Water Plant, RM 291, and the area just upstream of Meadowbrook Lake, RM 295.
Visualizing the flood reduction along the Pearl River
To visualize what communities receive the greatest levels of flood reduction benefits, the data is divided into four quantiles: The “largest drop” quantile, the “smallest drop” quantile, and two intermediary quantiles.
These quantiles can then be mapped along the river, as shown on the map below. This flood reduction ruler is used in the following demographic maps.
Mapping social, economic, and climate vulnerabilities with the Climate and Economic Justice Screening Tool (CEJST)
The CEJST is a mapping tool developed under the directive of Presidential Executive Order 14008 to help national decision-makers identify communities vulnerable to problems caused by climate, economic, or climate changes.
The CEJST is a mapping tool developed under the directive of Presidential Executive Order 14008 to help national decision-makers identify communities vulnerable to problems caused by climate, economic, or climate changes.
- The tool uses about 30 metrics from various databases to define eight categories of burdens. The 8 burden categories include: climate change, energy, health, housing, legacy pollution, transportation, water and wastewater, and workforce development. For example, a community has a "workforce development burden" if a large portion of the adult population in its census tract does not have a high school degree and at least one of four social conditions are met. Data for this burden are pulled from the American Community Survey of the United States Census.
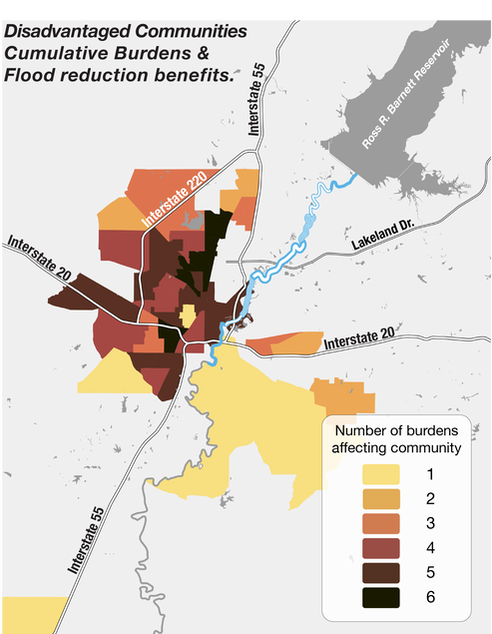
- A community is “disadvantaged” if it is in a census tract affected by one or more burdens. The map below shows "disadvantaged" communities within the Pearl River Flood Risk Management Project Area. Beyond what’s shown in the CEJST, the map also shows the number of burdens affecting each community. Several communities in Hinds and Rankin Counties are "disadvantaged" with at least one burden. Much of Jackson west of Interstate 55 is burdened by four to six categories. The following maps help visualize the potential flood reduction benefits provided by the "One Lake" project (Alternative C) to these "disadvantaged" communities.
Geospatial Clipping and Floodplain demographics
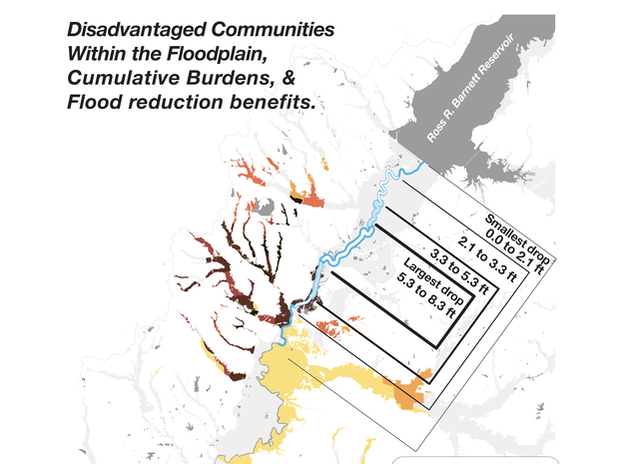
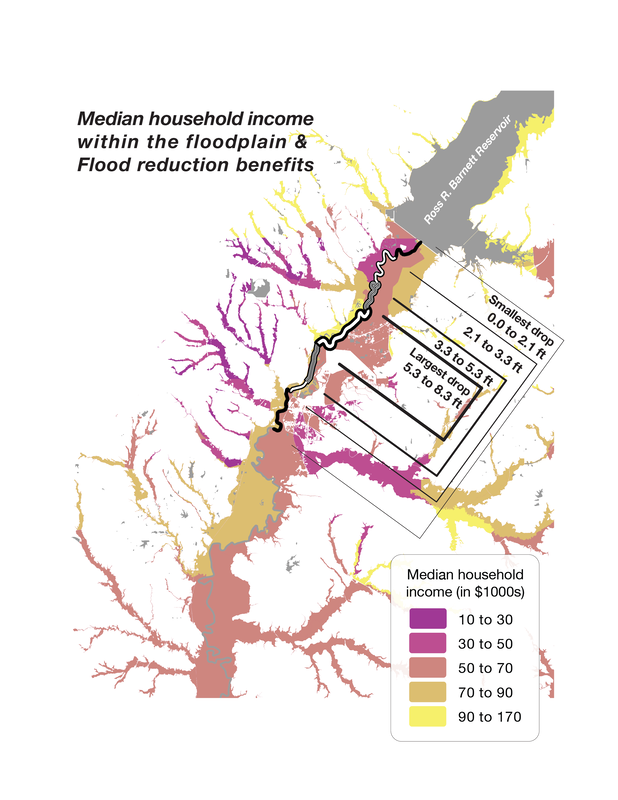
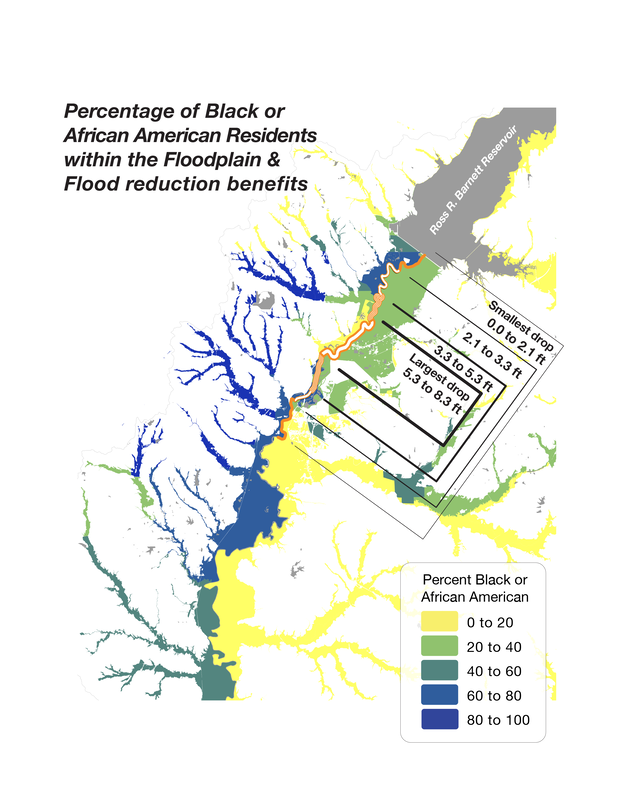
The communities most impacted by the flood reduction benefits of any project are those within in the floodplain. The map below approximates the demographics of these communies through clipping. Only the parts of a demographic map overlapping the floodplain are shown. The clipping operation is summarized here. View floodplain maps broken down by each of the 8 individual burden categories (including descriptions of each burden category) here.
The communities most impacted by the flood reduction benefits of any project are those within in the floodplain. The map below approximates the demographics of these communies through clipping. Only the parts of a demographic map overlapping the floodplain are shown. The clipping operation is summarized here. View floodplain maps broken down by each of the 8 individual burden categories (including descriptions of each burden category) here.
The most-disadvantaged communities surround the tributaries.
The "One Lake" project (Alternative C) could provide some flood reduction benefits to those surrounding Lynch and Town Creeks. Their mouths are between River Mile 286 and 288; the expected level of flood reduction in a 100-year flood within this stretch of the river ranges from 0.0 to 2.1 feet.
The "One Lake" project (Alternative C) could provide some flood reduction benefits to those surrounding Lynch and Town Creeks. Their mouths are between River Mile 286 and 288; the expected level of flood reduction in a 100-year flood within this stretch of the river ranges from 0.0 to 2.1 feet.
Additional demographic mapping of the floodplain
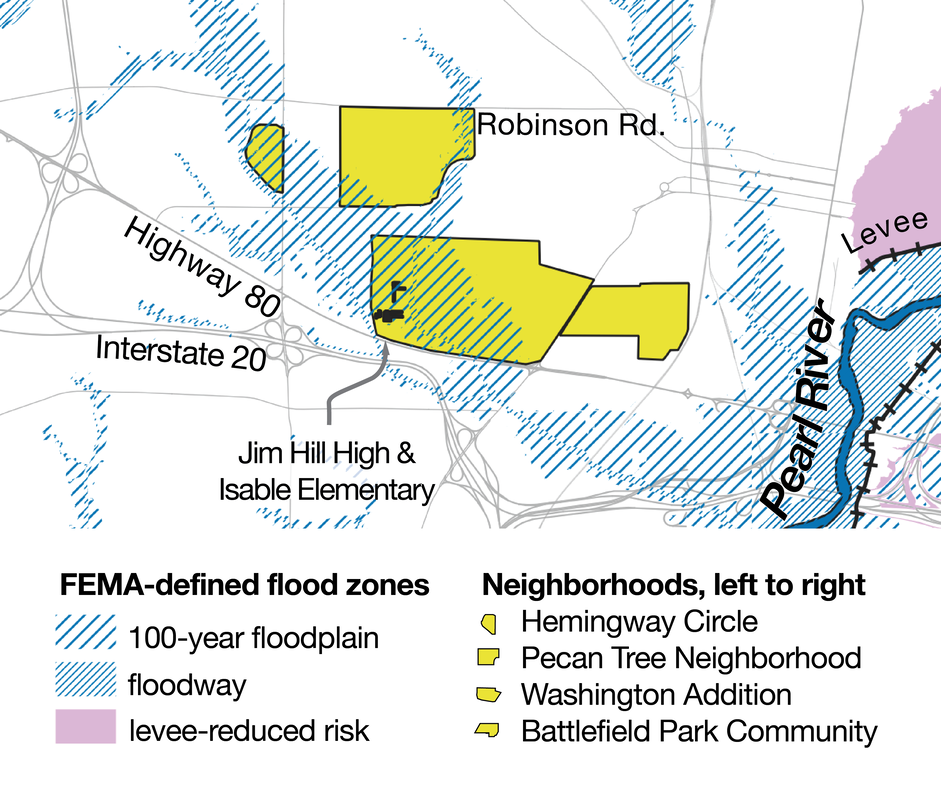
Mapping flooding in West Jackson, Ward 5
Pearl Riverkeeper asks that everyone make his or her own decision regarding the "One Lake" project (Alternative C) using sound science and engineering. We encourage the review and thorough analysis of all available information. We welcome comments and feedback. Please email Pearl Riverkeeper or visit our Facebook for comment space. Our publishing, or re-publishing, of anyone else's research or opinions is not an endorsement on our part of those conclusions.

